Observation Modes
In addition to bandpass in synphot,
stsynphot adds the capability to construct a bandpass by specifying a valid
string of HST instrument mode keywords (obsmode).
This bandpass is the wavelength-dependent sensitivity curve of the associated
photometer or spectrophotometer. Its overview is given at
observing mode overview.
A complete list of obsmode keywords can be found in
Appendix B: OBSMODE Keywords.
Observation mode can be passed into band(), which
supports the strings below, to create a bandpass:
'acs,hrc,f555w', which produces a set of chained throughputs that follow the light path through the telescope and the instrument'johnson,v', which produces a single throughput and is the same as reading in just$PYSYN_CDBS/comp/nonhst/johnson_v_004_syn.fitsusingsynphot.spectrum.SpectralElement.from_file()that does not account for telescope optics
For performance, some lookup tables are cached. They contain graph, component,
and pixel scale information. The cache can be reset using
reset_cache().
Examples
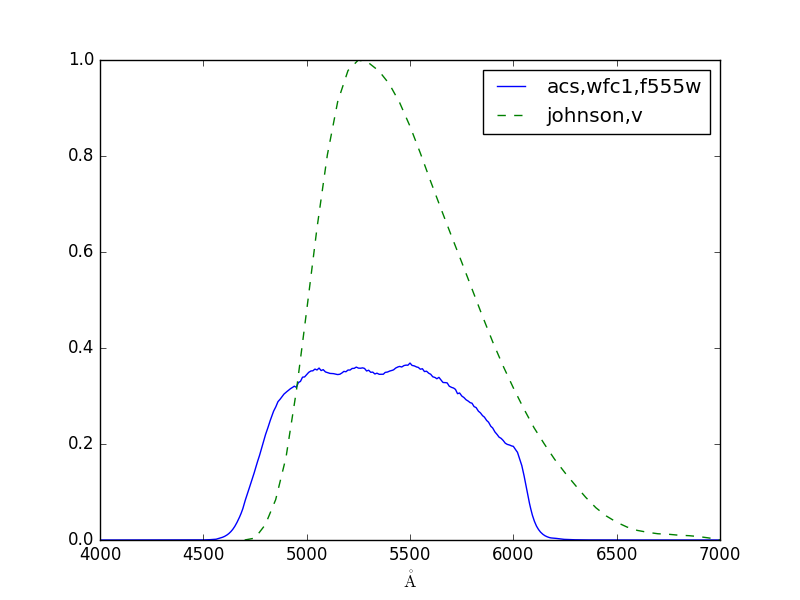
Create a bandpass for HST/ACS instrument with its WFC1 detector and F555W filter:
>>> import stsynphot as stsyn
>>> bp_acs = stsyn.band('acs,wfc1,f555w')
To see which throughput tables are being used, as set by CRDS:
>>> bp_acs.showfiles()
/my/local/dir/trds/comp/ota/hst_ota_007_syn.fits
/my/local/dir/trds/comp/acs/acs_wfc_im123_004_syn.fits
/my/local/dir/trds/comp/acs/acs_f555w_wfc_005_syn.fits
/my/local/dir/trds/comp/acs/acs_wfc_ebe_win12f_005_syn.fits
/my/local/dir/trds/comp/acs/acs_wfc_ccd1_mjd_021_syn.fits [...]
Create a bandpass for Johnson V:
>>> bp_v = stsyn.band('johnson,v')
Compare them in a plot:
>>> import matplotlib.pyplot as plt
>>> from astropy.visualization import quantity_support
>>> quantity_support()
>>> plt.plot(bp_acs.waveset, bp_acs(bp_acs.waveset), 'b',
...          bp_v.waveset, bp_v(bp_v.waveset), 'g--')
>>> plt.xlim(4000, 7000)
>>> plt.legend([bp_acs.obsmode, bp_v.obsmode], loc='best')
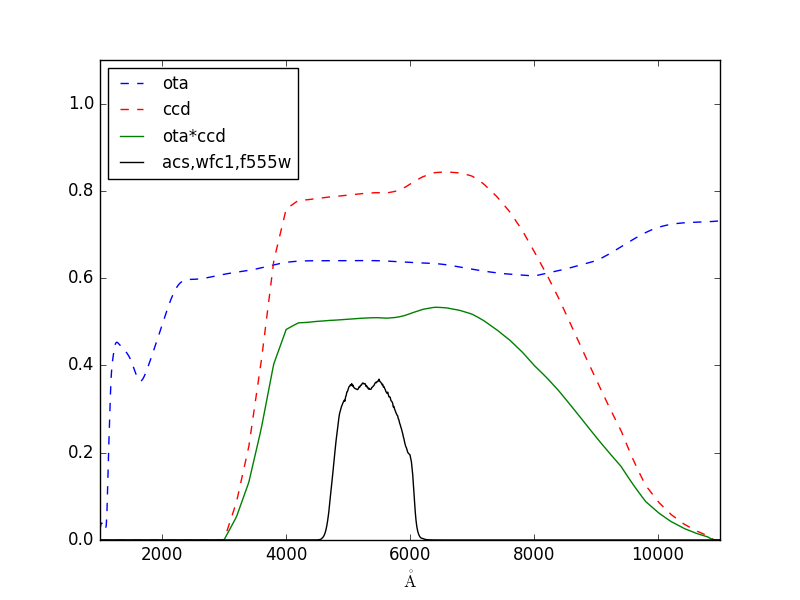
Read the HST OTA and ACS/WFC1 CCD transmissions from files and multiply them. Then plot the actual bandpass and overlay those components:
>>> from synphot import SpectralElement
>>> ota = SpectralElement.from_file(
...     '/my/local/dir/trds/comp/ota/hst_ota_007_syn.fits')
>>> ccd = SpectralElement.from_file(
...     '/my/local/dir/trds/comp/acs/acs_wfc_ccd1_mjd_021_syn.fits')
>>> bp_partial = ota * ccd
>>> w = bp_acs.binset  # waveset that is optimal for binning
>>> plt.plot(w, ota(w), 'b--', w, ccd(w), 'r--', w, bp_partial(w), 'g', w, bp_acs(w), 'k')
>>> plt.xlim(w[0], w[-1])
>>> plt.ylim(0, 1.1)
>>> plt.legend(['ota', 'ccd', 'ota*ccd', bp_acs.obsmode], loc='upper left', fontsize=12)
Pixel and Wavelength Ranges
An observation created using a bandpass from an observation mode has a binned
component associated with the its detector.
binned_pixelrange() and
binned_waverange() can be
used to calculate the pixel and wavelength ranges, respectively, spanned by the
observation mode given its binset, if available.
The example below calculates the number of pixels covered from 8600.5 to 12400.5 Angstrom. Then, it calculates the starting and ending wavelengths covered by 3800 pixels centered at 10500 Angstrom:
>>> import stsynphot as stsyn
>>> from astropy import units as u
>>> bp = stsyn.band('wfc3,ir,f105w')
>>> bp.binned_pixelrange([8600.5, 12400.5] * u.AA)
3800
>>> bp.binned_waverange(10500 * u.AA, 3800)
<Quantity [  8600.5, 12400.5] Angstrom>
Thermal Background
For IR detectors (e.g., NICMOS and WFC3), thermal background can be calculated
using thermback().
The thermal component is defined by thermtable in the software
configuration system (see Installation and Setup).
For non-IR detectors, calling this method will raise NotImplementedError.
For example:
>>> import stsynphot as stsyn
>>> bp_wfc3 = stsyn.band('wfc3,ir,f105w')
>>> bp_wfc3.thermback()
<Quantity 0.05118250271971978 ct / (pix s)>
>>> bp_acs = stsyn.band('acs,wfc1,f555w')
>>> bp_acs.thermback()
...
NotImplementedError: No thermal support provided for acs,wfc1,f555w
To plot the thermal spectrum for WFC3/IR bandpass above:
>>> thsp = bp_wfc3.obsmode.thermal_spectrum()
>>> thsp.plot(left=14000, right=18500)
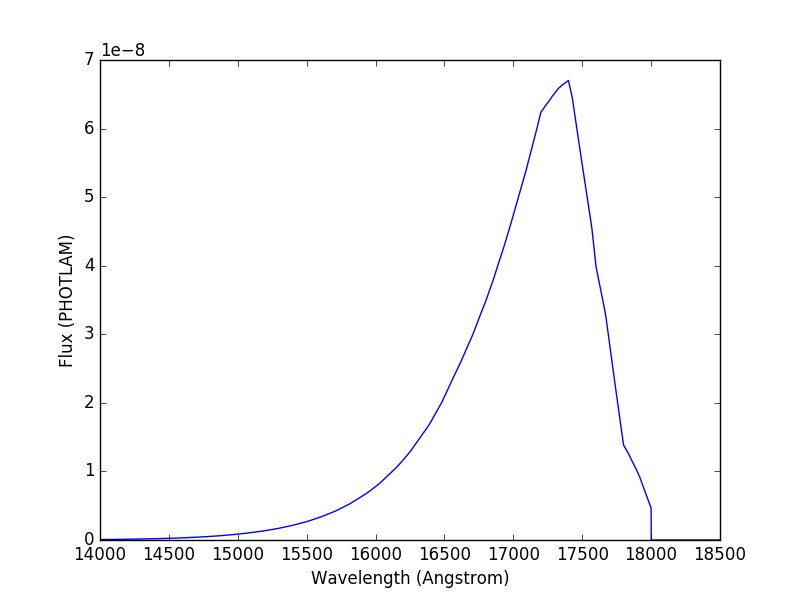
WFC3/IR detector, for instance, stores thermal information in its
$PYSYN_CDBS/comp/wfc3/*_th.fits files.
In the table header (Extension 1) of each file, there are two keywords:
DEFT, the detector effective temperature in KelvinBEAMFILL, the beam filling factor (usually 1)
stsynphot uses this information, applying the thermal emissivity to the optical beam to create a thermal source, as follows:
Blackbody source is generated using the
DEFTvalue.Thermal source is generated by multiplying the blackbody with thermal emissivity and the
BEAMFILLvalue.If the observation mode has multiple thermal components, their respective thermal source are added together.
This source is then integrated and converted to count rate using the instrument pixel scale and telescope collecting area. The result is reported as thermal background.
Color Index
Bandpass from observation mode can also be used to calculate color indices by comparing an observation taken with it with the same observation in another bandpass. The color index in magnitude is computed by subtracting the effective stimuli of the two observations; while in linear flux unit, by dividing them.
The example below (adapted from an example in the documentation of IRAF SYNPHOT
calcphot task) shows you how to calculate the color indices of a
2500 K blackbody in Cousins I and HST/WFC3 UVIS1 F814W bandpasses:
>>> import stsynphot as stsyn
>>> from synphot import SourceSpectrum, Observation
>>> from synphot.models import BlackBodyNorm1D
>>> # Create the blackbody
>>> bb = SourceSpectrum(BlackBodyNorm1D, temperature=2500)
>>> # Create WFC3 observation
>>> obs_wfc3 = Observation(bb, stsyn.band('wfc3,uvis1,f814w'))
>>> # Create Cousins I observation using WFC3 binning for consistency
>>> obs_i = Observation(bb, stsyn.band('i'), binset=obs_wfc3.binset)
>>> # Color index in instrumental magnitude
>>> area = stsyn.conf.area
>>> obs_i.effstim('obmag', area=area) - obs_wfc3.effstim('obmag', area=area)
<Quantity -1.2186293262909498 OBMAG>
>>> # Color index in FLA
>>> obs_i.effstim('flam') / obs_wfc3.effstim('flam')
<Quantity 0.9493324538593665>